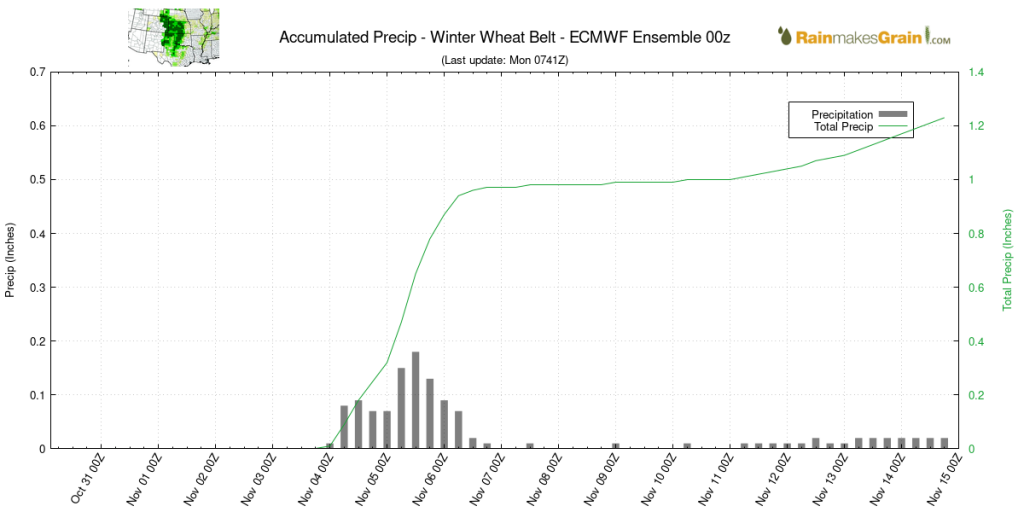
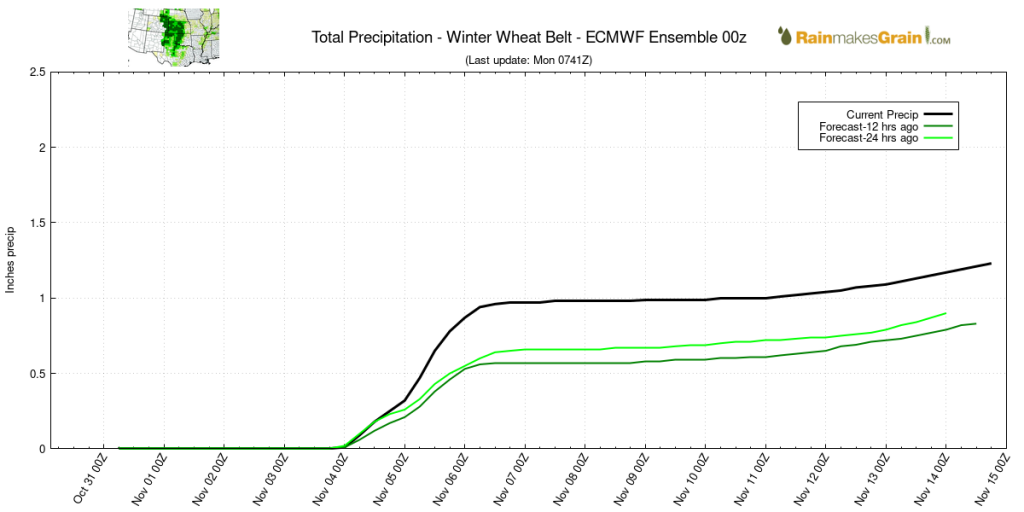
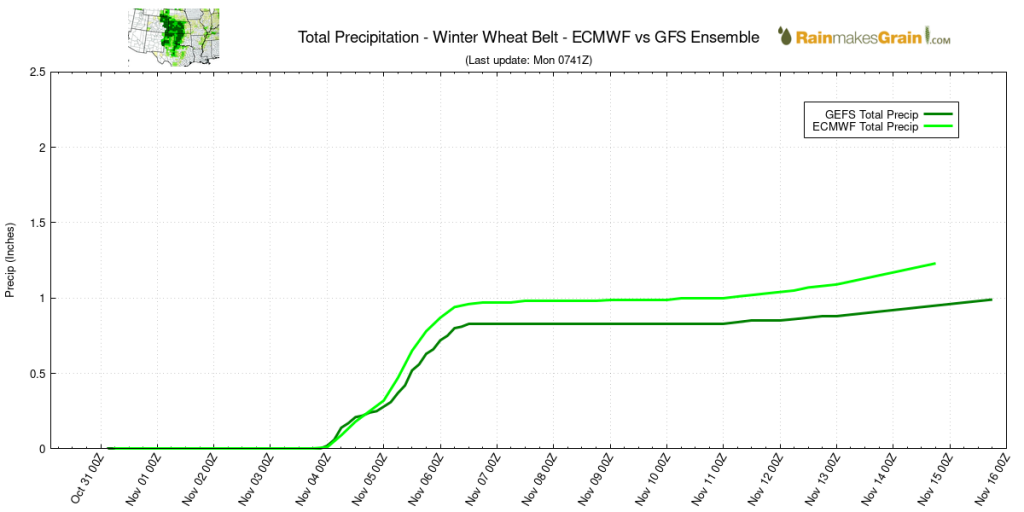
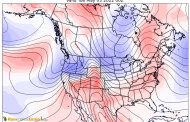
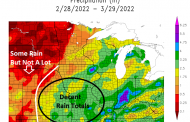
Using Rain Makes Grain weather data statistics can help the trader and farmer evaluate trends in rainfall forecasts across the drought parched Hard Winter Wheat Belt. Below are sample images from our Live weather statistics that shows forecast rainfall amounts across the Hard Winter Wheat Belt from the ECMWF ensemble data and how it’s trended over the past 24-hours. The last graph shows how the ECMWF forecast of rainfall for the next 15-days compares to the GFS ensemble data.
Rainfall forecast from the ECMWF Ensemble forecasting out 15-daysImage above shows the latest ECMWF ensemble forecast for the coming 15-days and how it compares to prior runs over the past 24-hours. The new run shows a jump in precipitation estimates, giving farmers and traders real-time trends of how weather patterns are changing. The image shows how the GFS and EC data compares with each other for the coming 15-day forecast. In the Image, the EC data is slightly wetter across the Hard Winter Wheat Belt than the GFS.
